CloudWatch logs is a cheap and easy to set up centralised logging solution. At the moment it lacks several valuable features such as a convenient way to search logs, however it does an excellent job at providing graphing and alerting on aggregated metrics pulled from ingested log data. An obvious application for this is to monitor HTTP server statistics to provide graphs of overall request rates, response sizes, and error rates.
OpsWorks makes it easy to orchestrate a fleet of EC2 instances serving multiple applications (as oppose to Elastic Beanstalk which only hosts a single application). Apache is the default HTTP server for most OpsWorks layer types.
This post demonstrates how to setup CloudWatch logs for Apache access logs on OpsWorks, then create custom CloudWatch metrics for an individual OpsWorks application to graph the HTTP request rate.
Installing the CloudWatch agent with Chef to monitor Apache logs
The first step is to install the CloudWatch agentusing a custom recipe. These instructions are based off the AWS documentation so follow those steps to configure your IAM instance role first.
Create the following files in your custom cookbooks repository, you can name the custom recipe anything you like but
in this example I’ve named it myrecipe.
1 2 3 4 5 6 7 8 9 10 11 12 13 14 15 16 17 18 19 20 | |
1 2 3 4 5 6 7 8 9 10 11 | |
The significant line is file = <%= node[:apache][:log_dir] %>/*-access.log which
sets the log location to the Apache HTTP access logs.
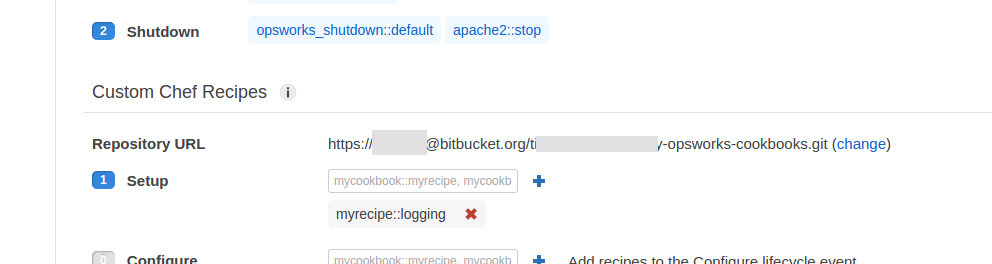
Next, add this recipe to the setup lifecycle event of your OpsWorks layer:
Including application in Apache access logs
The other change we need to make is to include the application name in the Apache access logs, otherwise we won’t be able to filter by application when creating a logging metric in CloudWatch.
To do this you need to override the Apache vhost template in the OpsWorks cookbooks. The recipe containing this template
will depend on the application type, for example it’s located in mod_php5_apache2/templates/default/web_app.conf.erb or
passenger_apache2/templates/default/web_app.conf.erb for PHP and Ruby applications respectively.
In this example we’ll assume a PHP application, so create the following file in your custom cookbooks repository:
1 2 3 4 5 6 7 8 9 10 11 12 13 14 15 16 17 18 19 20 21 22 23 24 25 26 27 28 29 30 31 32 33 34 35 36 37 38 39 40 41 42 43 44 45 46 47 48 49 50 51 52 53 54 55 56 57 58 59 60 61 62 63 64 65 66 67 68 69 70 71 72 73 74 75 76 77 78 79 80 81 82 83 84 85 86 87 88 89 90 91 92 93 94 95 96 97 98 99 100 101 102 103 104 105 106 107 108 109 110 111 112 113 114 115 116 117 118 119 120 121 122 | |
This configuration is based on the default template so it may be best to start with the latest template file on GitHub.
Note the following lines which are relevant:
LogFormat "%h %l %u %t \"%r\" %>s %b \"%{Referer}i\" \"%{User-agent}i\" \"<%= @params[:name] %>\"" combinedwithapp
This is creating a new log format called combinedweithapp, it’s the same as the combined format except the app name
is appended to the end.
CustomLog <%= node[:apache][:log_dir] %>/<%= @params[:name] %>-access.log combinedwithapp
CustomLog <%= node[:apache][:log_dir] %>/<%= @params[:name] %>-ssl-access.log combinedwithapp
This is telling both the HTTP and HTTPS access logs to use the new custom format.
Testing the logging
If you now launch an instance, wait for it to come online then load the App a few times you should begin to see logs appearing in CloudWatch after a few minutes.
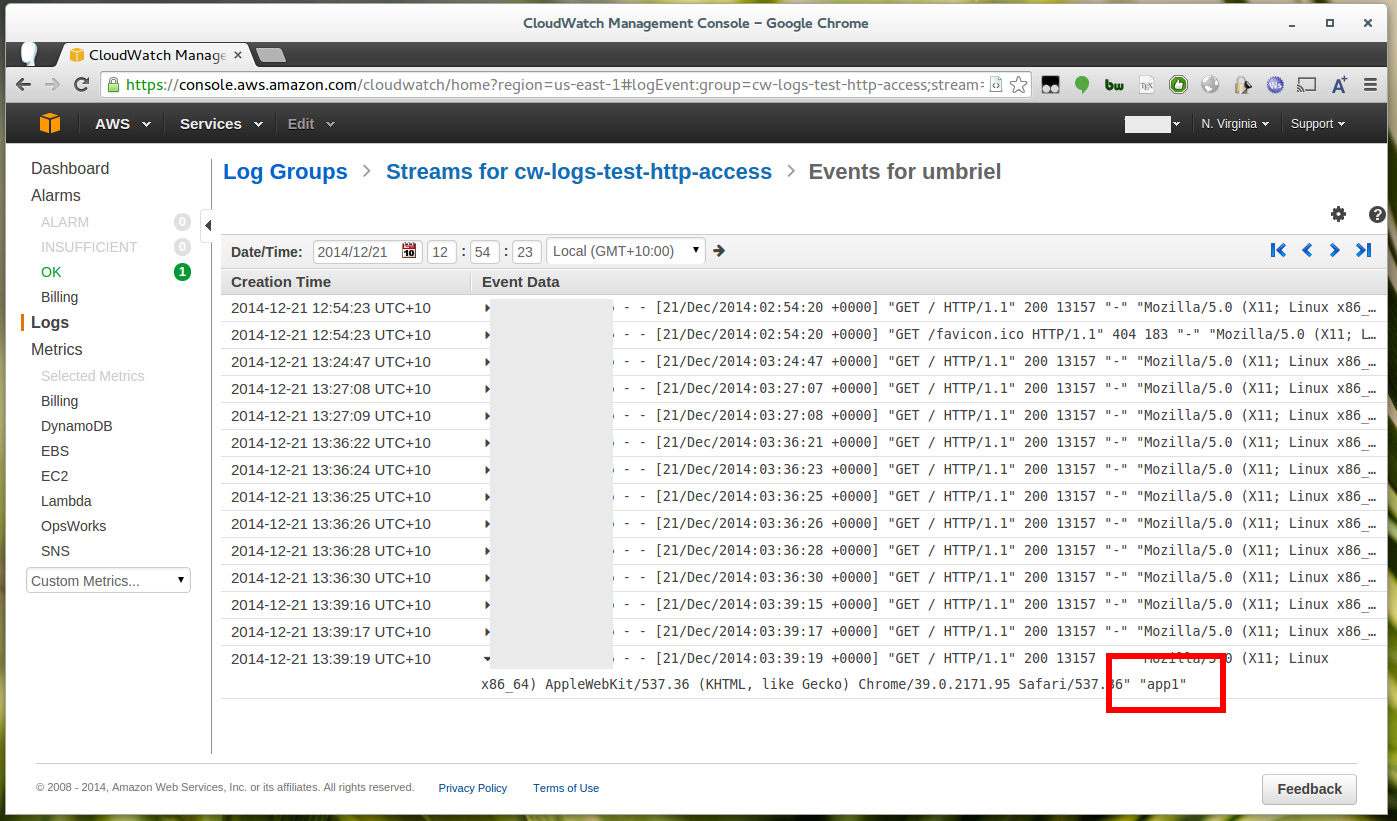
This indicates that the CloudWatch agent is working, you should also be able to see the app name. You’ll notice that logs are nicely categorized by stack and instance too.
Creating a metric to monitor HTTP requests by App
How that we have Apache access logs being sent to CloudWatch including the App name we can setup a metric to monitor the number of requests made to this application.
From the “Log Groups” screen in CloudWatch, tick the appropriate log group (cw-logs-test-http-access in this example) and then
click “Create Metric Filter” at the top.
Enter the following Filter Pattern:
[host, logName, user, timestamp, request, statusCode, size, referer, useragent, app=app1, ...]
Note that you should replace app1 with the name of the app you’re interested in.
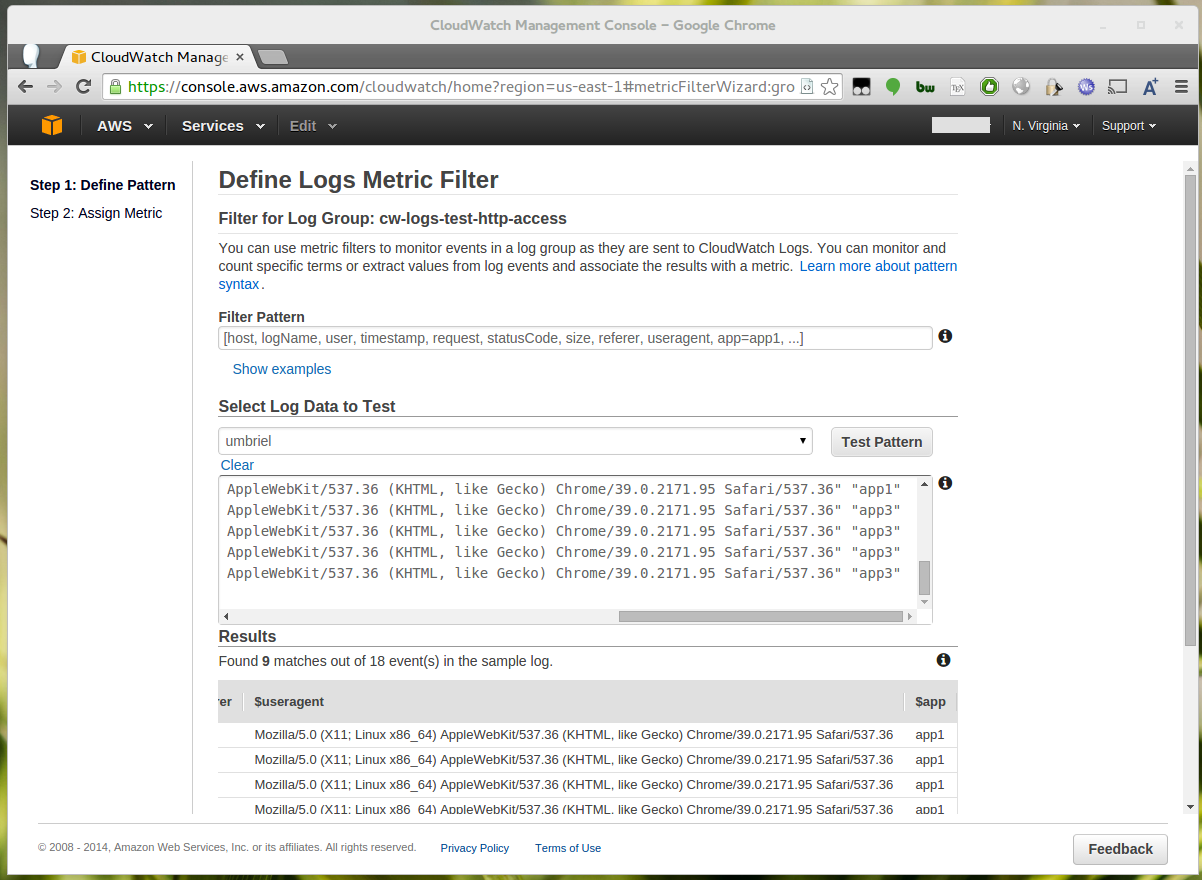
You can test your filter pattern, otherwise proceed by clicking “Assign Metric”.
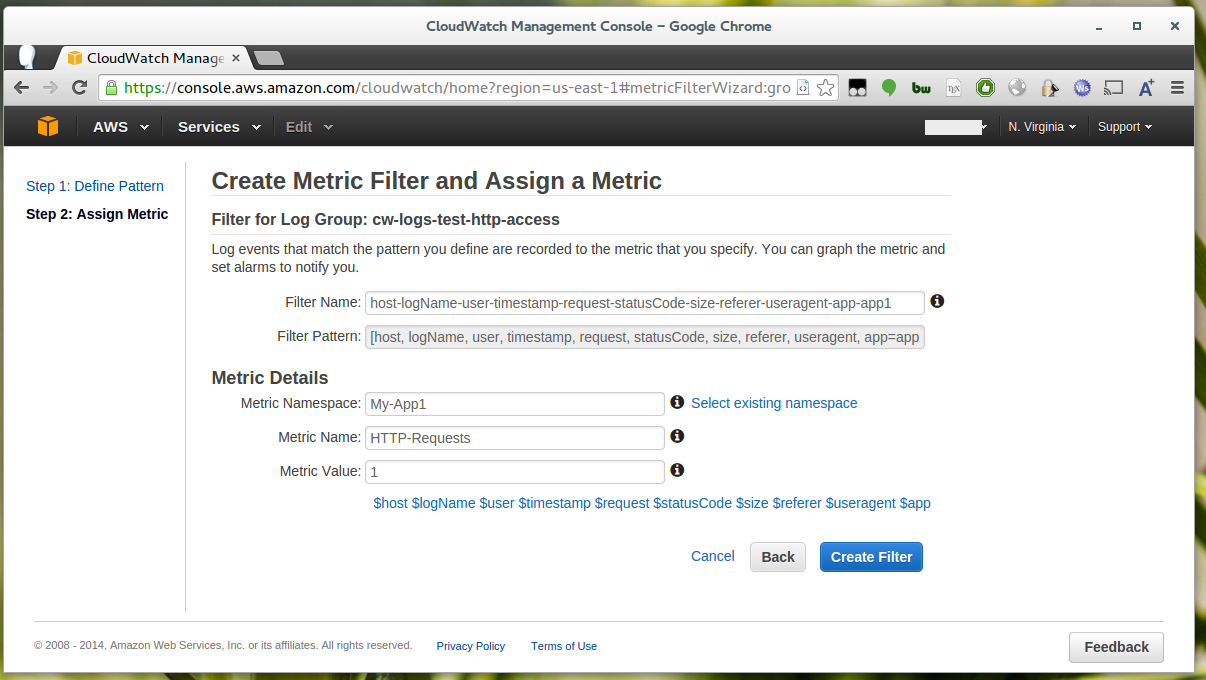
Give your new metric an appropriate namespace (group) and name. As we’re only interested in the number of requests the “Metric Value” is 1 (1 per request).
Viewing the results
Once you’ve created the metric you won’t see data until more logs matching that criteria occur, so either generate some traffic on your app or wait for some to come in. There can be a delay of about 5 minutes for metrics data to appear.
After data has been recorded into the metric you should be able to find that metric either by searching the metrics list or from the “Custom Metrics” drop down which will appear after you refresh the page.
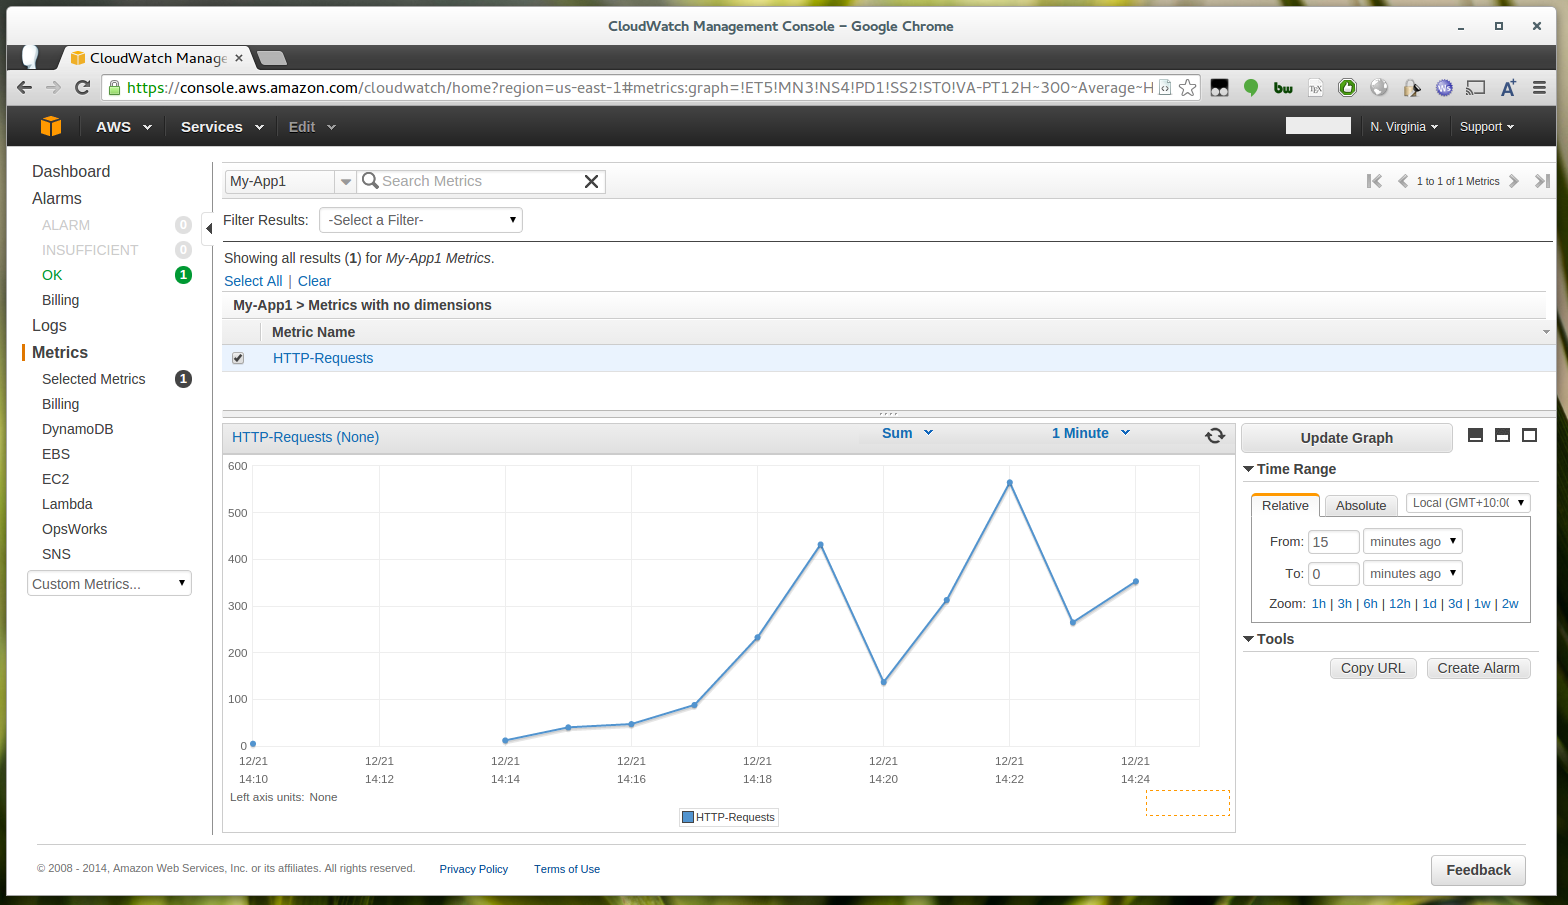
Change the aggregation type from “average” to “sum” and you should now see a nice graph of the requests going to your app over time. You can change the interval to 1 minute to get the most detailed graph.
Other metrics
In this example we’re only interested in the number of HTTP requests, but you can easily create additional metrics for things like 4xx errors or response size (to get an estimate of bandwidth usage by app).
To graph 4xx errors use a Filter Pattern like this (note the statusCode field):
[host, logName, user, timestamp, request, statusCode=4*, size, referer, useragent, app=app1, ...]
To graph response size enter $size instead of 1 as the “Metric Value” when creating the metric.
To monitor multiple apps simply create additional sets of your custom metrics, each with a different app filter.