If you followed Part 1 you’ll now have your CloudWatch logs sitting conveniently in S3 to be analysed. You could now download them and search each file individually using grep or a similar tool, but it would be much nicer to be able to search by field and construct complex queries with multiple conditions.
Thankfully you have Elastic Map Reduce (EMR) at your disposal, which can help you analyse your logs straight from S3 using a nice UI (Hue) and with an SQL-like query language you’re already familiar with (Hive). EMR is typically employed to process terabytes of data, but it works well on relatively small data-sets too and will easily scale up if you happen to have a huge amount of logs to process. Running an on-demand EMR cluster for 6 hours also only costs less than $2.
This blog post will cover setting up an EMR cluster, logging into Hue, then using Hive to format and query the Apache HTTP access logs exported from CloudWatch in Part 1.
Creating your EMR cluster
From the EMR console click “Create cluster”.
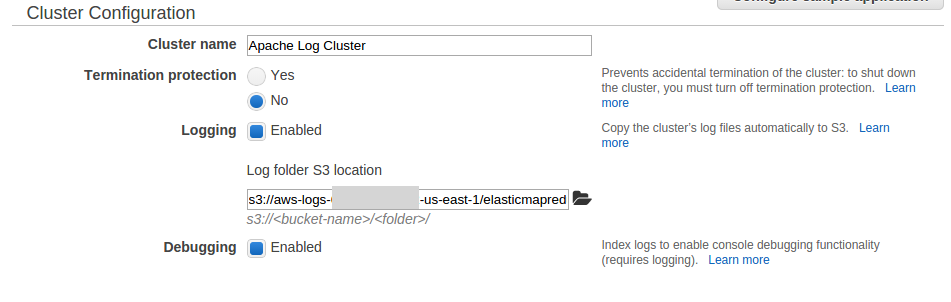
Fill out the basic options such as cluster name, disable termination protection and enable logging and debugging.
Leave Tags, Software Configuration and File System Configuration as Default.
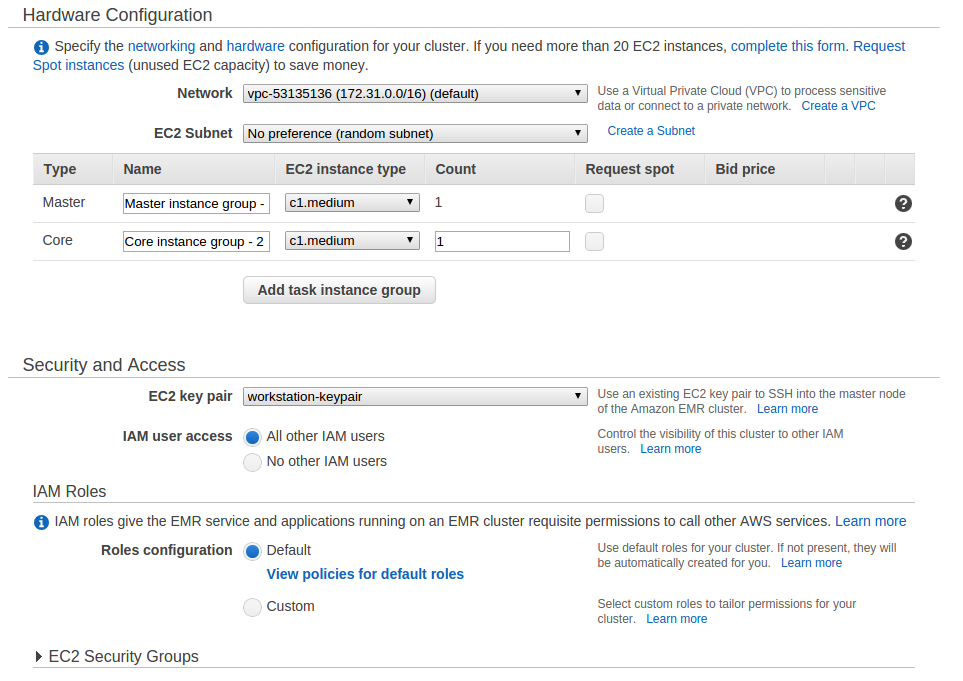
For a minimal sized cluster select only a single master and core node. The c1.medium instance type is a good place to start if you want the smallest cluster possible.
I’d strongly recommend assigning an EC2 key pair so you can log in via SSH. If you don’t already have a key pair then you can add one in advance by following these instructions.
The network, IAM and role configuration can stay as default unless you’d prefer stricter security policies than default.
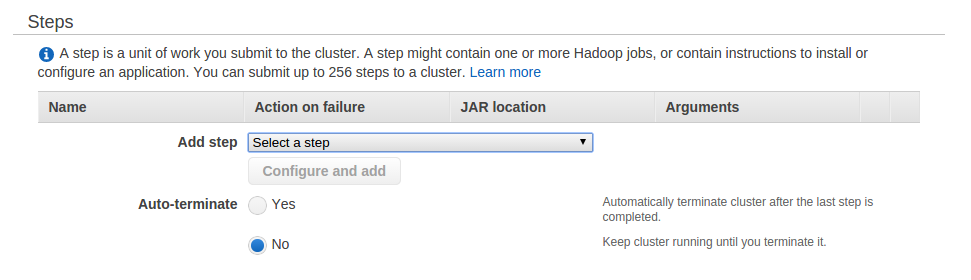
Leave the Steps as-is, but ensure Auto-terminate is set to no as we’ll be using the cluster interactively and will terminate it manually.
Finally, click Create cluster.
Wait for your cluster to be provisioned
It can take about 15 minutes for your cluster to be fully provisioned.
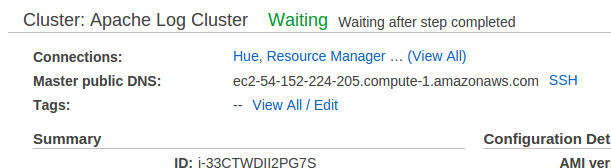
Once provisioned the status should change to waiting.
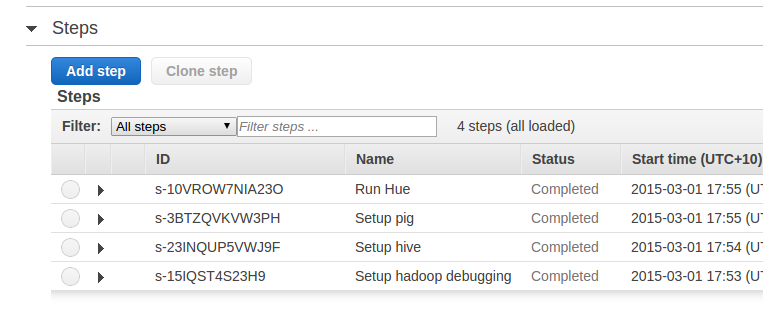
The steps should also all have a Status of complete.
Connecting to Hue web UI
The Hue UI is accessible at http://[your master public DNS]:8888. For example in my case the URL is http://ec2-54-152-224-205.compute-1.amazonaws.com:8888.
By default the security groups prevent external access to the Hue UI. You have two options to enable access:
Option 1: SSH tunneling
The most secure method is to use SSH tunneling to access the web UI. Detailed instructions are available here. This will require the key pair you specified when creating the cluster.
Option 2: Opening up security group
Another alternative is to open up the security group rules to allow access to your public IP. This is perhaps the easiest but keep in mind there will be no encryption of your connection.
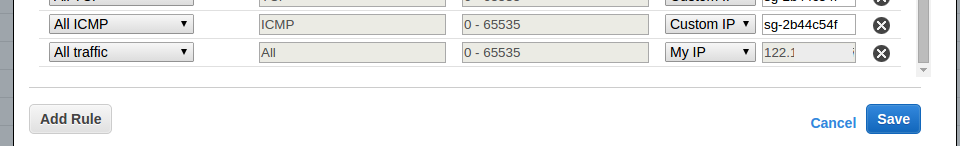
Go to the EC2 console and edit the inbound rules for the ElasticMapReduce-master security group. Add a rule to allow all traffic from your IP.
Logging into Hue
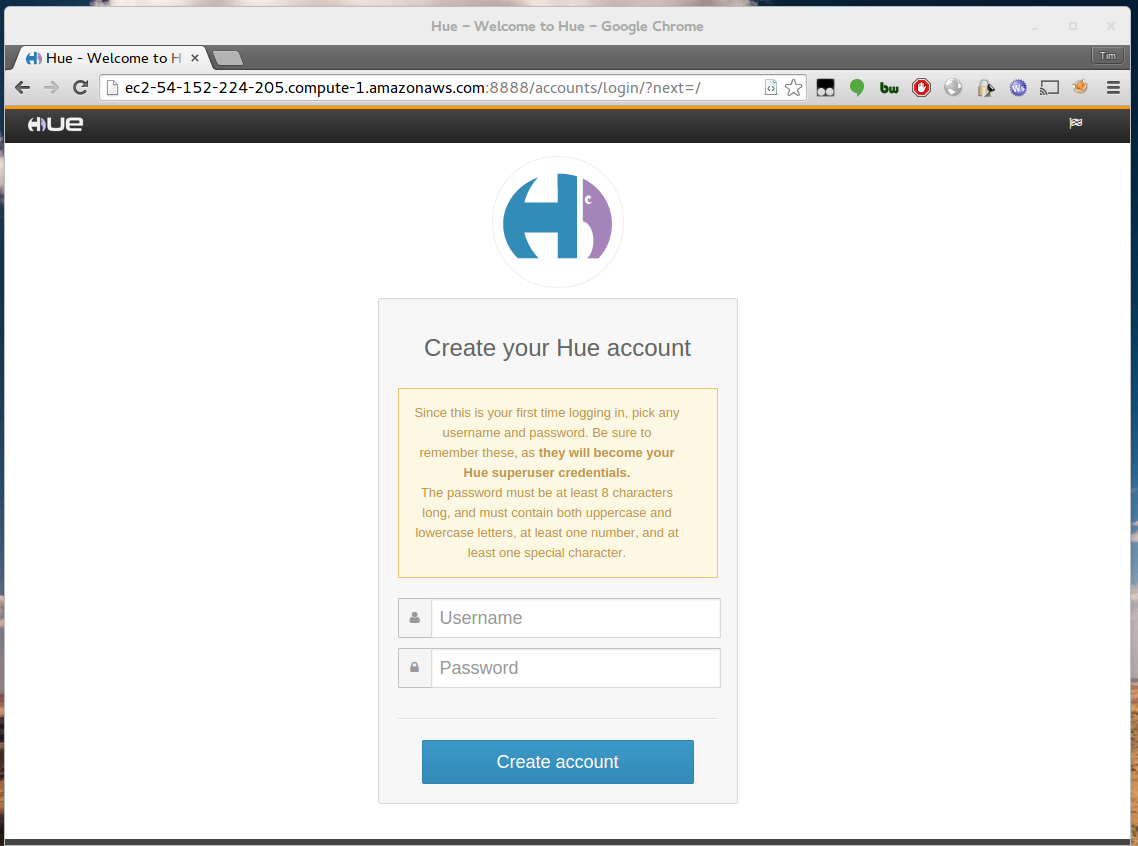
Open the Hue UI url in your web browser and follow the instructions to set a password and log in.
Creating table for logs
Once logged in dismiss the set-up prompt and select Hive under the Query Editors drop down.
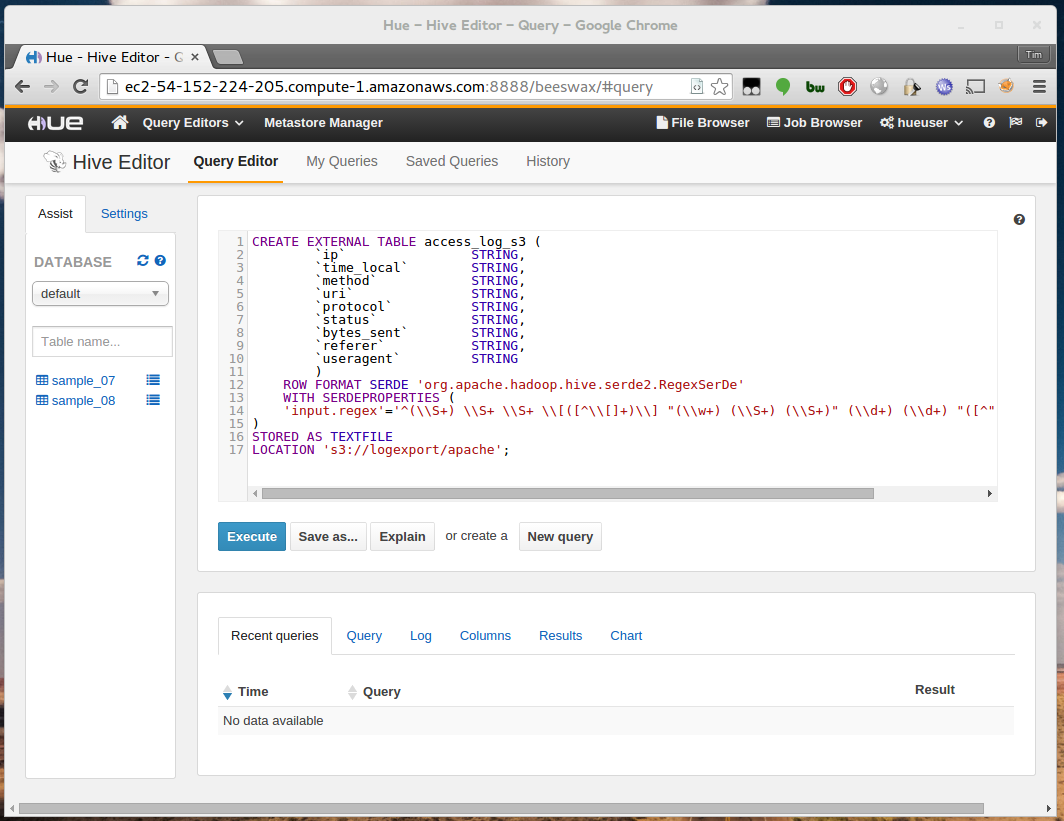
Enter the following query into the query editor:
1 2 3 4 5 6 7 8 9 10 11 12 13 14 15 16 17 | |
Replace s3://logexport/apache with your own bucket path. If you have a different log format then you can customise
the regular expression and columns to suit.
Click Execute.
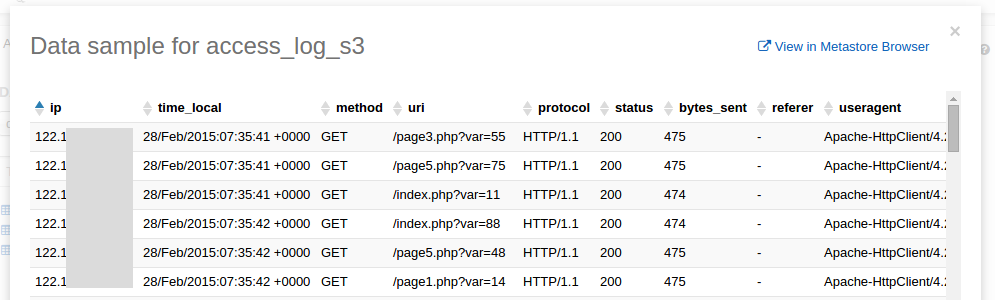
If you refresh the table list in the left column you should now see your new table. You can click the preview icon to see a sample of your formatted data.
Querying logs
You’re now ready to begin analysing your logs! You can find a full reference on the Hive query language here , however it should be very familiar if you know basic SQL.
For example, if I run:
1
| |
I can see the returned logs under the results tab.
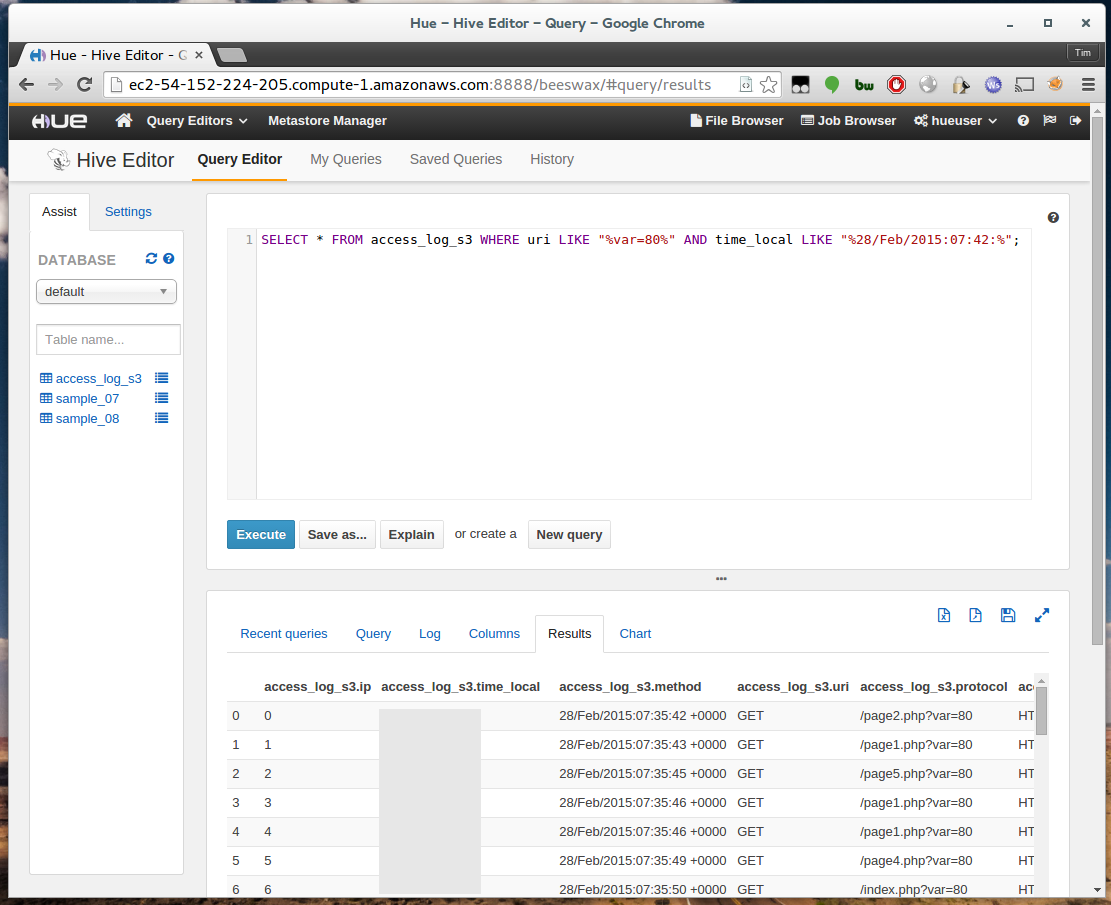
In my case it took around 60 seconds to process and return the query, however this will depend on how many logs you have, the query you’re running, and the instance types you’re using.
From the results tab you can easily export your results as a CSV or create a new table to refine further.
Cleaning up
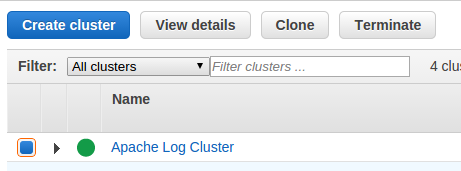
Once you’re finished simply return to the EMR console and terminate the cluster.
You may also want to delete the S3 bucket and Data Pipeline.
Automating periodic analysis
This blog post describes an ad-hoc scenario where you might want to occupationally perform manual analysis. However, Data Pipeline is the perfect tool for automating periodic log analysis. You can leverage the Hive Activity to build a Pipeline which automatically exports the logs then runs then analyses them on a schedule.
Part 1
Click here to revisit Part 1.