You’ve just discovered one of your instances has been hacked! A new instance is being launched to replace it, but you have no idea how the attacker got access in the first place and you need to stop it happening again. The clues are hidden somewhere in your HTTP access logs which are conveniently sitting in CloudWatch logs. Unfortunately accessing and analysing those logs from CloudWatch isn’t as simple as you thought. The only refinement available is by ingestion time and there’s no way you can trawl through days of logs by hand. You’ll need to analyse the logs externally but that’s a challenge too - there’s no automated export to S3 and the GetLogEvents API action is limited to pages of 1MB and 10 requests per second. Once you get the logs out you have to figure out how to analyse them, what you’re looking for is too complex for simple text searches and loading tens of GB of logs into an RDBMS would be tedious.
Fortunately you found this blog post! Elastic Map Reduce (EMR) allows you to quickly and conveniently create a Hadoop cluster running Hive. It might seem like overkill to use Hadoop to process just a few GB of logs once-off, but Hive provides a convenient SQL-like interface and works perfectly fine at small scale. Plus, considering you pay by the hour the cost is almost negligible.
The only question is how to get your logs out of CloudWatch and into S3 for EMR to process, so I recently wrote a small tool called cwlogs-s3 to help with this process. Part 1 of this blog post will cover how to export your logs to S3 using cwlogs-s3 and Data Pipeline, then Part 2 will cover how to analyse those logs with Hive on EMR.
Getting started
The first step is to create an AWS Data Pipeline to run cwlogs-s3, which is a command line utility written in Ruby and available as a gem.
You could of course run this gem manually on an EC2 instance or your own workstation, however AWS data pipeline provides a simple way to orchestrate creating an EC2 instance, installing the gem, running it, then terminating the instance upon conclusion.
The other benefit of Data Pipeline is that it’s hugely extensible, therefore you could easily convert this into an automated log-processing routine that runs on a schedule.
Creating destination S3 bucket
Create an S3 bucket for the exported logs and the Data Pipeline logs. I’ve called mine cwlogs-destination and inside
I’ve created two folders called dplogs and exportedlogs.
Granting IAM access to resource role
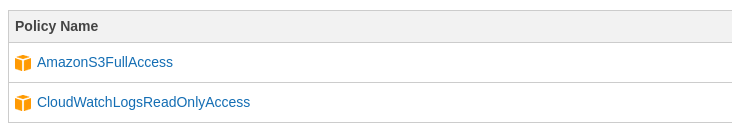
The IAM resource role requires read access to CloudWatch logs and read/write access to S3. By default the resource role
is called DataPipelineDefaultResourceRole. I’ve attached the AmazonS3FullAccess and CloudWatchLogsReadOnlyAccess
managed policies to the default role in this example, however you can create a more specific policy (which might limit
access only to specific buckets or log groups) and attach it to a custom resource role if desired.
Note: If you haven’t created a pipeline before the default resource role may not have been created. It should be created after the first pipeline you create.
Creating pipeline definition
Copy paste the following pipeline definition into a file called pipeline.json and save it on your workstation:
1 2 3 4 5 6 7 8 9 10 11 12 13 14 15 16 17 18 19 20 21 22 23 24 25 26 27 28 29 30 31 32 33 34 35 36 37 38 39 40 41 42 43 44 45 46 47 48 49 50 51 52 53 54 55 56 57 58 59 60 61 62 63 | |
Creating Pipeline
Go to the AWS Data Pipeline console and create a new pipeline.
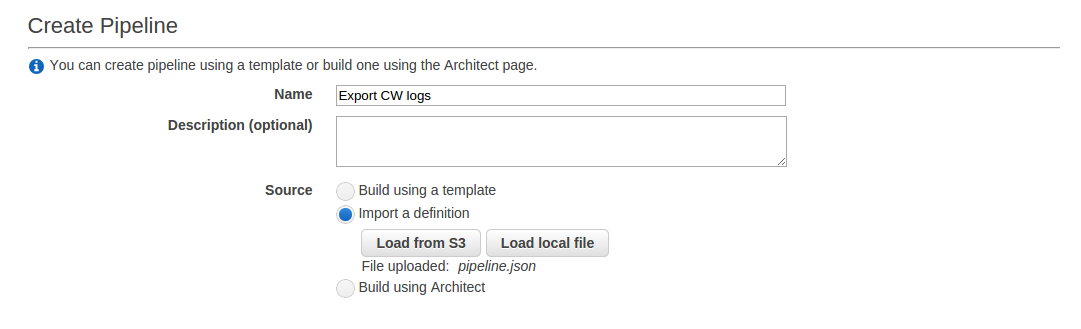
Enter a name for the pipeline and choose to import a definition by loading the pipeline.json file you created earlier.
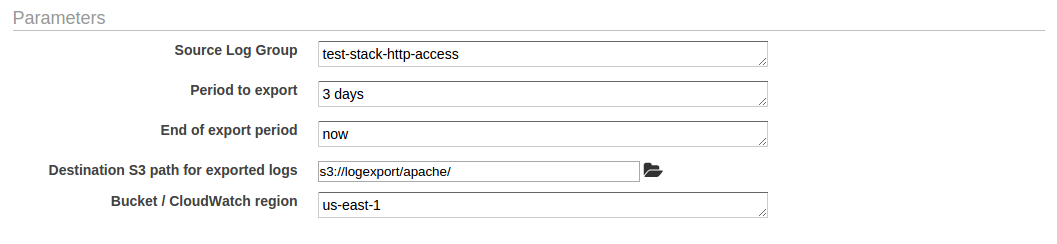
Fill out the parameters. You can browse to the folder within the S3 bucket you created earlier. The format of the period and end parameters can be any format supported by chronic duration and chronic respectively.
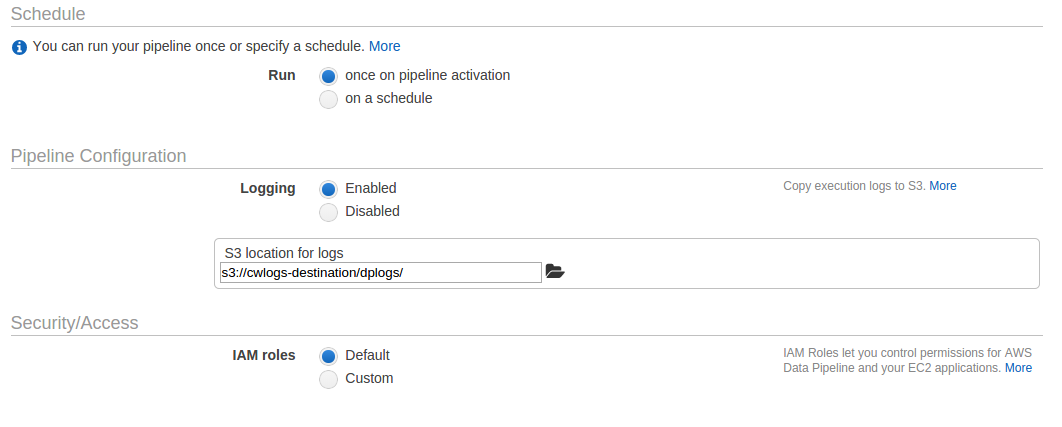
Leave the schedule as default, select the other folder you created as the logging destination and leave the IAM roles as default.
Finally, click “Activate”.
Monitoring Execution
Data Pipeline will now run through the process of spinning up a new EC2 instance, installing cwlogs-s3, running it with the supplied parameters, then terminating the instance. You can follow the process by clicking the refresh button at the top right of the pipeline view in the Data Pipeline console.
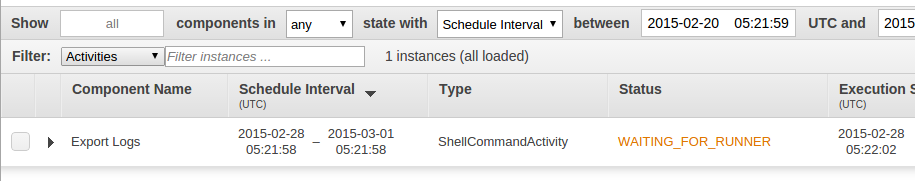
The status should progress through steps such as WAITING_FOR_RUNNER, RUNNING and FINISHED.
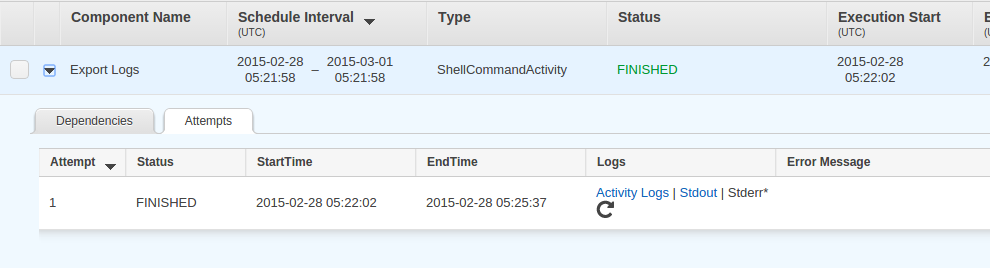
Once the task has been finished you should also have the option to view logs such as Stdout and Stderr. This is useful to debug any issues that might cause the task to fail.
Viewing exported data
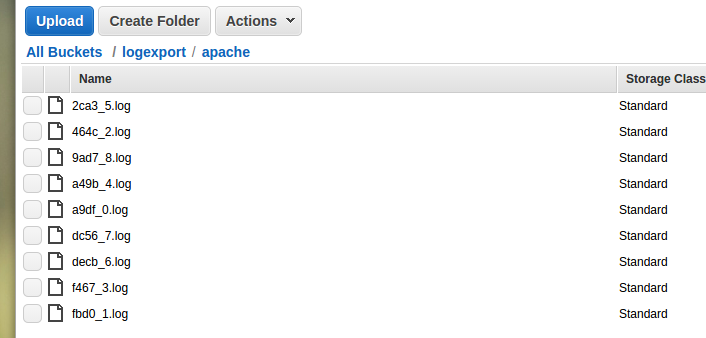
If you browse the destination in the S3 console you should now see a series of .log files containing your exported logs. The files each have a randomised prefix to improve S3 performance, however the suffix indicates the order in which they were exported.
Part 2
Click here to continue to Part 2.